


NAR released a summary of pending home sales data showing that June’s pending home sales pace increased 16.6% last month and rose 6.3% from a year ago. This would be the second consecutive month of gains as well as the first year over year incline since the virus’s impact on the housing market.
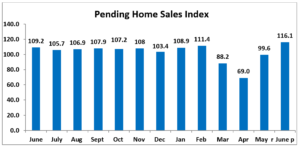

Bar chart: Pending Home Sales Index June 2019 to June 2020
Pending sales represent homes that have a signed contract to purchase on them but have yet to close. They tend to lead Existing Home Sales data by 1 to 2 months.
All three regions showed inclines from a year ago, except the Northeast which fell 0.9%. The West had the biggest gain in contract signings of 10.3% followed by the Midwest with an increase of 5.1%. The West had the smallest incline of 4.7%.
Bar chart: U.S. and Regional Pending Sales June 2020 and June 2019
From last month, all four regions showed double-digit gains in contract signings. The Northeast had the most significant increase of 54.4% followed by the Midwest with an incline of 12.2%. The South rose 11.9% followed by the West with the smallest gain in signings of 11.7%.
The U.S. pending home sales index level for the month was 116.1.

June’s incline brings the pending index above the 100-level mark for the first time since February 2020.
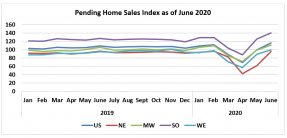
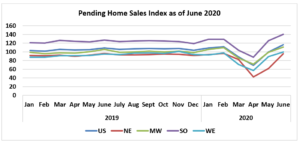
Line graph: Pending Home Sales Index as of June 2020 by Region
The 100 level is based on a 2001 benchmark and is consistent with a healthy market and existing-home sales above the 5 million mark.
Copyright with permission National Association of Realtors